Bacterial molecular epidemiologists have a lot to learn from our virus-studying friends.
A great example is the ‘epidemic’ website over at http://epidemic.bio.ed.ac.uk/, which has the byline “Molecular Epidemiology and Evolution of Viral Pathogens” and is led by the wonderful Andrew Rambaut of BEAST fame.
The site currently covers Coronavirus (where the current concern is Middle Eastern Respiratory Syndrome or MERS, which is a close relative of SARS) and influenza. There are really cool features, including the visual display of spatial and epidemiological data on current outbreaks, collated from numerous sources (http://epidemic.bio.ed.ac.uk/coronavirus_background) as well as regular blog posts about new cases, sequences and analyses. The data is stored on github, which means anyone can easily access it (fork it in git language), add and edit data, and generally share the love.
There is also a fantastic blog post by Andrew Rambaut explaining How To Read A Phylogenetic Tree, with a particular focus on epidemiological analyses, e.g. how to interpret pathogen trees from different hosts to learn about transmission between hosts.
As I often say, if there is one thing better than a good tree, it’s a good tree with a map… so I’m super excited by the phylogeography software Pandemix which facilitates visualisation of tree + map data, with a temporal animation thrown in for good measure (!), over the web. Go here to see it in action on MERS data.
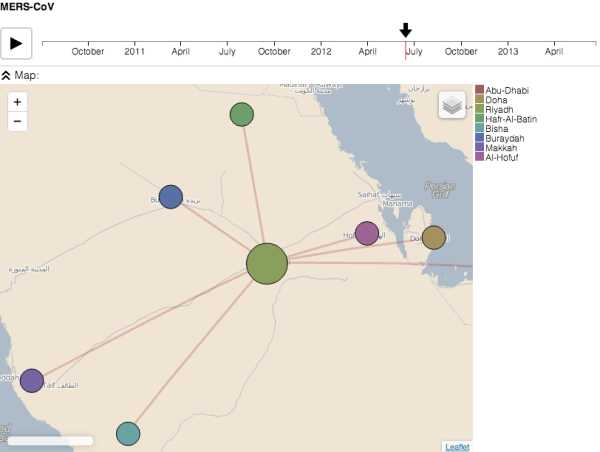
Screenshot of Pandemix showing MERS data from Cotten et al (2013) in The Lancet. See http://epidemic.bio.ed.ac.uk/mers-cov_phylogeography
